Consolidated Data Tables, Sensitivity Workings, Material Reference Data
Annexure to the White Paper: Notional Decarbonization Assessment for a 50,000 sq ft Commercial Interior Project
These tables form part of the original work of Amit Garg and IǪUBX Private Limited and must be read in conjunction with the accompanying white paper; all rights are reserved. This publication is an original work of Amit Garg and IǪUBX Private Limited; all rights in its text, frameworks, analyses, calculations, diagrams and presentation are reserved. Expanded clause is given in the end of the document
Annexure A: Consolidated Carbon Impact Tables
Initial Embodied Carbon — All Systems
All values in tCO2e unless stated otherwise.
| # | System | Quantity | Conv. Unit Carbon | Conv. Initial (tCO2e) | IQUBX Unit Carbon | IQUBX
Initial (tCO2e) |
Initial Saving (tCO2e) |
| 1 | Glass partitions | 2,044 sqm | 58.0 kg/sqm | 118.6 | 50.5 kg/sqm | 103.2 | 15.4 |
| 2 | Solid partitions | 1,672 sqm | 95.0 kg/sqm | 158.8 | 72.0 kg/sqm | 120.4 | 38.4 |
| 3 | SkyHatch ceiling | Package | Package | 18.0 | Package | 22.0 | -4.0 |
| 4 | Workstations | 350 nos | 0.18 t/unit | 63.0 | 0.12 t/unit | 42.0 | 21.0 |
| 5 | Baffle ceilings | 743 sqm | 25.0 kg/sqm | 18.6 | 18.0 kg/sqm | 13.4 | 5.2 |
| 6 | Doors and frames | 120 nos | 0.35 t/unit | 42.0 | 0.25 t/unit | 30.0 | 12.0 |
| 7 | Pods | 10 nos | 3.0 t/unit | 30.0 | 2.3 t/unit | 23.0 | 7.0 |
| 8 | Feature panelling | 557 sqm | 55.0 kg/sqm | 30.6 | 45.0 kg/sqm | 25.1 | 5.5 |
| Total | 479.6 | 379.1 | 100.5 |
Whole Interior Carbon Impact Summary
| Parameter | Value |
| Total interior initial embodied carbon (at 500 kgCO2e/sqm) | 2,322.0 tCO2e |
| Assessed systems as share of total | 21% |
| Conventional 10-year total | 2,694.8 tCO2e |
| IQUBX 10-year total | 2,304.2 tCO2e |
| Absolute saving | 390.6 tCO2e |
| % reduction in total 10-year interior lifecycle carbon | 14.5% |
| % avoided carbon relative to initial interior embodied carbon | 16.8% |
Composition of Total Saving
| Component | tCO2e | Share |
| Initial embodied carbon saving | 100.5 | 25.7% |
| Lifecycle avoided carbon saving | 290.1 | 74.3% |
| Total | 390.6 | 100% |
-
Lifecycle Replacement Factors — All Systems
All lifecycle add-on values in tCO2e. Replacement factor = lifecycle add-on carbon as percentage of initial carbon.
| # | System | Conv.
Replacement Factor |
Conv. Lifecycle Add-On (tCO2e) | IQUBX
Replacement Factor |
IQUBX Lifecycle Add-On (tCO2e) | Lifecycle Saving (tCO2e) |
| 1 | Glass partitions | 75% | 88.9 | 22% | 22.7 | 66.2 |
| 2 | Solid partitions | 95% | 150.9 | 25% | 30.1 | 120.8 |
| 3 | SkyHatch ceiling | 250% | 45.0 | 55% | 12.0 | 33.0 |
| 4 | Workstations | 55% | 34.7 | 15% | 6.3 | 28.4 |
| 5 | Baffle ceilings | 35% | 6.5 | 10% | 1.3 | 5.2 |
| 6 | Doors and frames | 25% | 10.5 | 10% | 3.0 | 7.5 |
| 7 | Pods | 70% | 21.0 | 15% | 3.5 | 17.5 |
| 8 | Feature panelling | 50% | 15.3 | 15% | 3.8 | 11.5 |
| Total | 372.8 | 82.7 | 290.1 |
Lifecycle add-on carbon reduction: 290.1 / 372.8 = 77.8%
Total 10-Year Carbon — All Systems (Detailed)
All values in tCO2e.
| # | System | Conv. Initial | Conv. Lifecycle | Conv. 10-yr Total | IQUBX
Initial |
IQUBX
Lifecycle |
IQUBX 10-
yr Total |
System Saving | % Red. |
| 1 | Glass partitions | 118.6 | 88.9 | 207.5 | 103.2 | 22.7 | 125.9 | 81.6 | 39% |
| 2 | Solid partitions | 158.8 | 150.9 | 309.7 | 120.4 | 30.1 | 150.5 | 159.2 | 51% |
| 3 | SkyHatch ceiling | 18.0 | 45.0 | 63.0 | 22.0 | 12.0 | 34.0 | 29.0 | 46% |
| 4 | Workstations | 63.0 | 34.7 | 97.7 | 42.0 | 6.3 | 48.3 | 49.4 | 51% |
| 5 | Baffle ceilings | 18.6 | 6.5 | 25.1 | 13.4 | 1.3 | 14.7 | 10.4 | 41% |
| 6 | Doors and frames | 42.0 | 10.5 | 52.5 | 30.0 | 3.0 | 33.0 | 19.5 | 37% |
| 7 | Pods | 30.0 | 21.0 | 51.0 | 23.0 | 3.5 | 26.5 | 24.5 | 48% |
| 8 | Feature panelling | 30.6 | 15.3 | 45.9 | 25.1 | 3.8 | 28.9 | 17.0 | 37% |
| Total | 479.6 | 372.8 | 852.4 | 379.1 | 82.7 | 461.8 | 390.6 | 45.8% |
Annexure B: Sensitivity Analysis — Detailed Workings
Lifecycle Replacement Factor Sensitivity (±25%)
| Scenario | Conv. 10-yr Total | IQUBX 10-yr Total | Total Saving | % Reduction |
| Base case | 852.4 | 461.8 | 390.6 | 45.8% |
| Conservative (-25% conv. factors) | 759.5 | 441.1 | 318.4 | 41.9% |
| Favourable (+25% conv. factors) | 945.3 | 482.5 | 462.8 | 49.0% |
Even under the most conservative scenario, the total saving remains above 318 tCO2e with a reduction above 41%. The directional conclusion holds robustly across the full range.
Glass Reuse Rate Sensitivity
| Glass Reuse Rate | Glass Partition Saving | Impact on Total Saving |
| 75% (base case) | 81.6 tCO2e | 390.6 tCO2e |
| 60% | 72.8 tCO2e | 381.8 tCO2e |
| 50% | 66.9 tCO2e | 375.9 tCO2e |
Recycled Aluminium Content Sensitivity
| Recycled Content | Carbon Reduction Factor | Initial Saving | Total Saving |
| 75% (base) | 50% frame reduction | 100.5 tCO2e | 390.6 tCO2e |
| 50% (conservative) | 33% frame reduction | 78.2 tCO2e | 368.3 tCO2e |
Solid Partition Lifecycle Factor Sensitivity
| Conv. Lifecycle Factor | Solid Partition Saving | Impact on Total Saving |
| 120% (higher churn) | 178.7 tCO2e | 410.1 tCO2e |
| 95% (base case) | 159.2 tCO2e | 390.6 tCO2e |
| 70% (reduced) | 119.5 tCO2e | 350.9 tCO2e |
Alternative Interior Benchmark (350 kgCO2e/sqm)
| Parameter | At 500 kgCO2e/sqm | At 350 kgCO2e/sqm |
| Total interior initial carbon | 2,322.0 tCO2e | 1,625.8 tCO2e |
| Assessed scope as % of total | 20.7% | 29.5% |
| Conventional 10-yr total | 2,694.8 tCO2e | 1,998.6 tCO2e |
| IQUBX 10-yr total | 2,304.2 tCO2e | 1,608.0 tCO2e |
| Absolute saving | 390.6 tCO2e | 390.6 tCO2e |
| % reduction | 14.5% | 19.5% |
The percentage reduction increases under a lower benchmark because IQUBX-assessed systems become a larger share of the total interior.
Combined Worst-Case Scenario
Simultaneous conservative adjustments: conventional lifecycle factors -25%; IQUBX lifecycle factors +5%; glass reuse at 50%; recycled content at 50%.
Estimated total saving: approximately 280–295 tCO2e
Estimated reduction within assessed scope: approximately 35–37%
This represents the floor of the defensible saving range. Even under combined worst-case conditions, the carbon reduction remains substantial and directionally consistent with the thesis.
Annexure C: Material Carbon Reference Data
Aluminium — Published Carbon Intensity Values
| Source | Material | kgCO2e/kg | Notes |
| ICE Database (EU avg) | Aluminium, extruded, 31% recycled | 6.83 | World average recycled content |
| Aluminium Extruders Council (N. America) | Aluminium, extruded, 69% recycled | 10.25 | Different energy mix accounting |
| OpenCO2.net | Aluminium, primary production | 14.77 | Cradle-to-gate, no recycled content |
| Hydro REDUXA | Low-carbon aluminium (hydropower) | 4.00 | Among lowest available globally |
| ICE Database range | Recycled aluminium | 0.5–2.5 | Varies by process and alloy |
Aluminium — Recycled Content in Building Products
| Source | Region | Recycled Content | Year |
| Aluminum Association (US) | North America | 60%+ | 2024 |
| International Aluminium Institute | Global average | 33% | 2023 |
| IQUBX (working assumption) | India / GCC | 75% | 2026 |
Partition Service Life — Published Research
| Source | Finding | Value | Context |
| Schneider-Marin et al. | Gypsum board service life in offices | 20 years | Due to user changes, not physical deterioration |
| Urlainis et al. (2024) | Gypsum board replacement (intensive) | 11–27 years | Applied Sciences, MDPI |
| Buyle et al. | Interior partition refurbishment cycle | Every 15 years | 60-year building lifespan |
| Baker Partition Wall (2026) | Modular partition disassembly rate | 80% | Industry report |
| Mateus et al. (2024) | Prefab vs conventional partition carbon reduction | ~40% | ScienceDirect |
Building Embodied Carbon Benchmarks
| Source | Benchmark | Value | Scope |
| RICS NZCBS (2023) | Most new-build projects | 450–650 kgCO2e/sqm | Whole building, upfront (A1-A5) |
| LETI | Aspirational target | 500 kgCO2e/sqm | Whole building |
| RIBA 2030 | Business-as-usual upfront | 850 kgCO2e/sqm | Whole building |
| RIBA 2030 target | 2030 whole life target | 625 kgCO2e/sqm | Whole building, whole life |
| This study | Premium Grade-A interior | 500 kgCO2e/sqm | Interior fit-out only |
| This study (alt.) | Standard interior | 350 kgCO2e/sqm | Interior fit-out, sensitivity |
Annexure D: Glossary of Terms and Acronyms
| Term | Definition |
| BOQ | Bill of Quantities — itemised list of materials and quantities in a construction project |
| CKD | Completely Knocked Down — products shipped as disassembled components for local assembly |
| DGU | Double Glazed Unit — two panes of glass with an air or gas gap |
| EPD | Environmental Product Declaration — standardised, third-party-verified environmental impact document (ISO 14025) |
| GreenPro | Type 1 Ecolabel certification by the Green Products and Services Council (CII body, India) |
| IAI | International Aluminium Institute |
| ICE Database | Inventory of Carbon and Energy — free embodied carbon database (University of Bath / Circular Ecology) |
| kgCO2e | Kilograms of carbon dioxide equivalent |
| LCA | Life Cycle Assessment — methodology for environmental impact calculation (ISO 14040/14044) |
| LETI | London Energy Transformation Initiative |
| MEP | Mechanical, Electrical, and Plumbing — building services infrastructure |
| RIBA | Royal Institute of British Architects |
| RICS | Royal Institution of Chartered Surveyors |
| RIS2050 | Ras Al Khaimah Integrated Sustainability Strategy 2050 |
| STC | Sound Transmission Class — acoustic rating system for partition performance |
| tCO2e | Metric tonnes of carbon dioxide equivalent |
| VIG | Vacuum Insulated Glass |
Annexure to: IQUBX Lifecycle Carbon Reduction Framework for Modular Interior Infrastructure — Revised Edition, July 2026
Prepared by Amit Garg, IQUBX Private Limited
Methodology, Copyright and Use Notice
© 2026 Amit Garg / IQUBX Private Limited. All rights reserved.
These calculation tables, assumptions, scenarios, material quantities, emission factors, formulas, comparative models, sensitivity analyses and resulting estimates form part of the original analytical work developed for the accompanying white paper:
[Lifecycle Carbon Reduction Framework for Modular Interior Infrastructure]
These tables must be read only in conjunction with the said white paper, including its methodology, definitions, system boundaries, assumptions, exclusions, qualifications and limitations.
The calculations constitute a transparent, notional and assumption-based analytical framework. They are not a certified lifecycle assessment, environmental product declaration, project certification or universally applicable carbon claim.
The structure, selection of assumptions, analytical logic, formulas, comparisons, tables, graphics and interpretation contained in this work may not be copied, adapted, republished, commercially used or presented as the work of another person or organisation without prior written permission.
Any authorised quotation or reference must clearly acknowledge Amit Garg and IQUBX Private Limited and cite the accompanying white paper.
[wpcode id=”4843″]
Related Posts
-
 Lifecycle Carbon Reduction Framework for Modular Interior Infrastructure
-
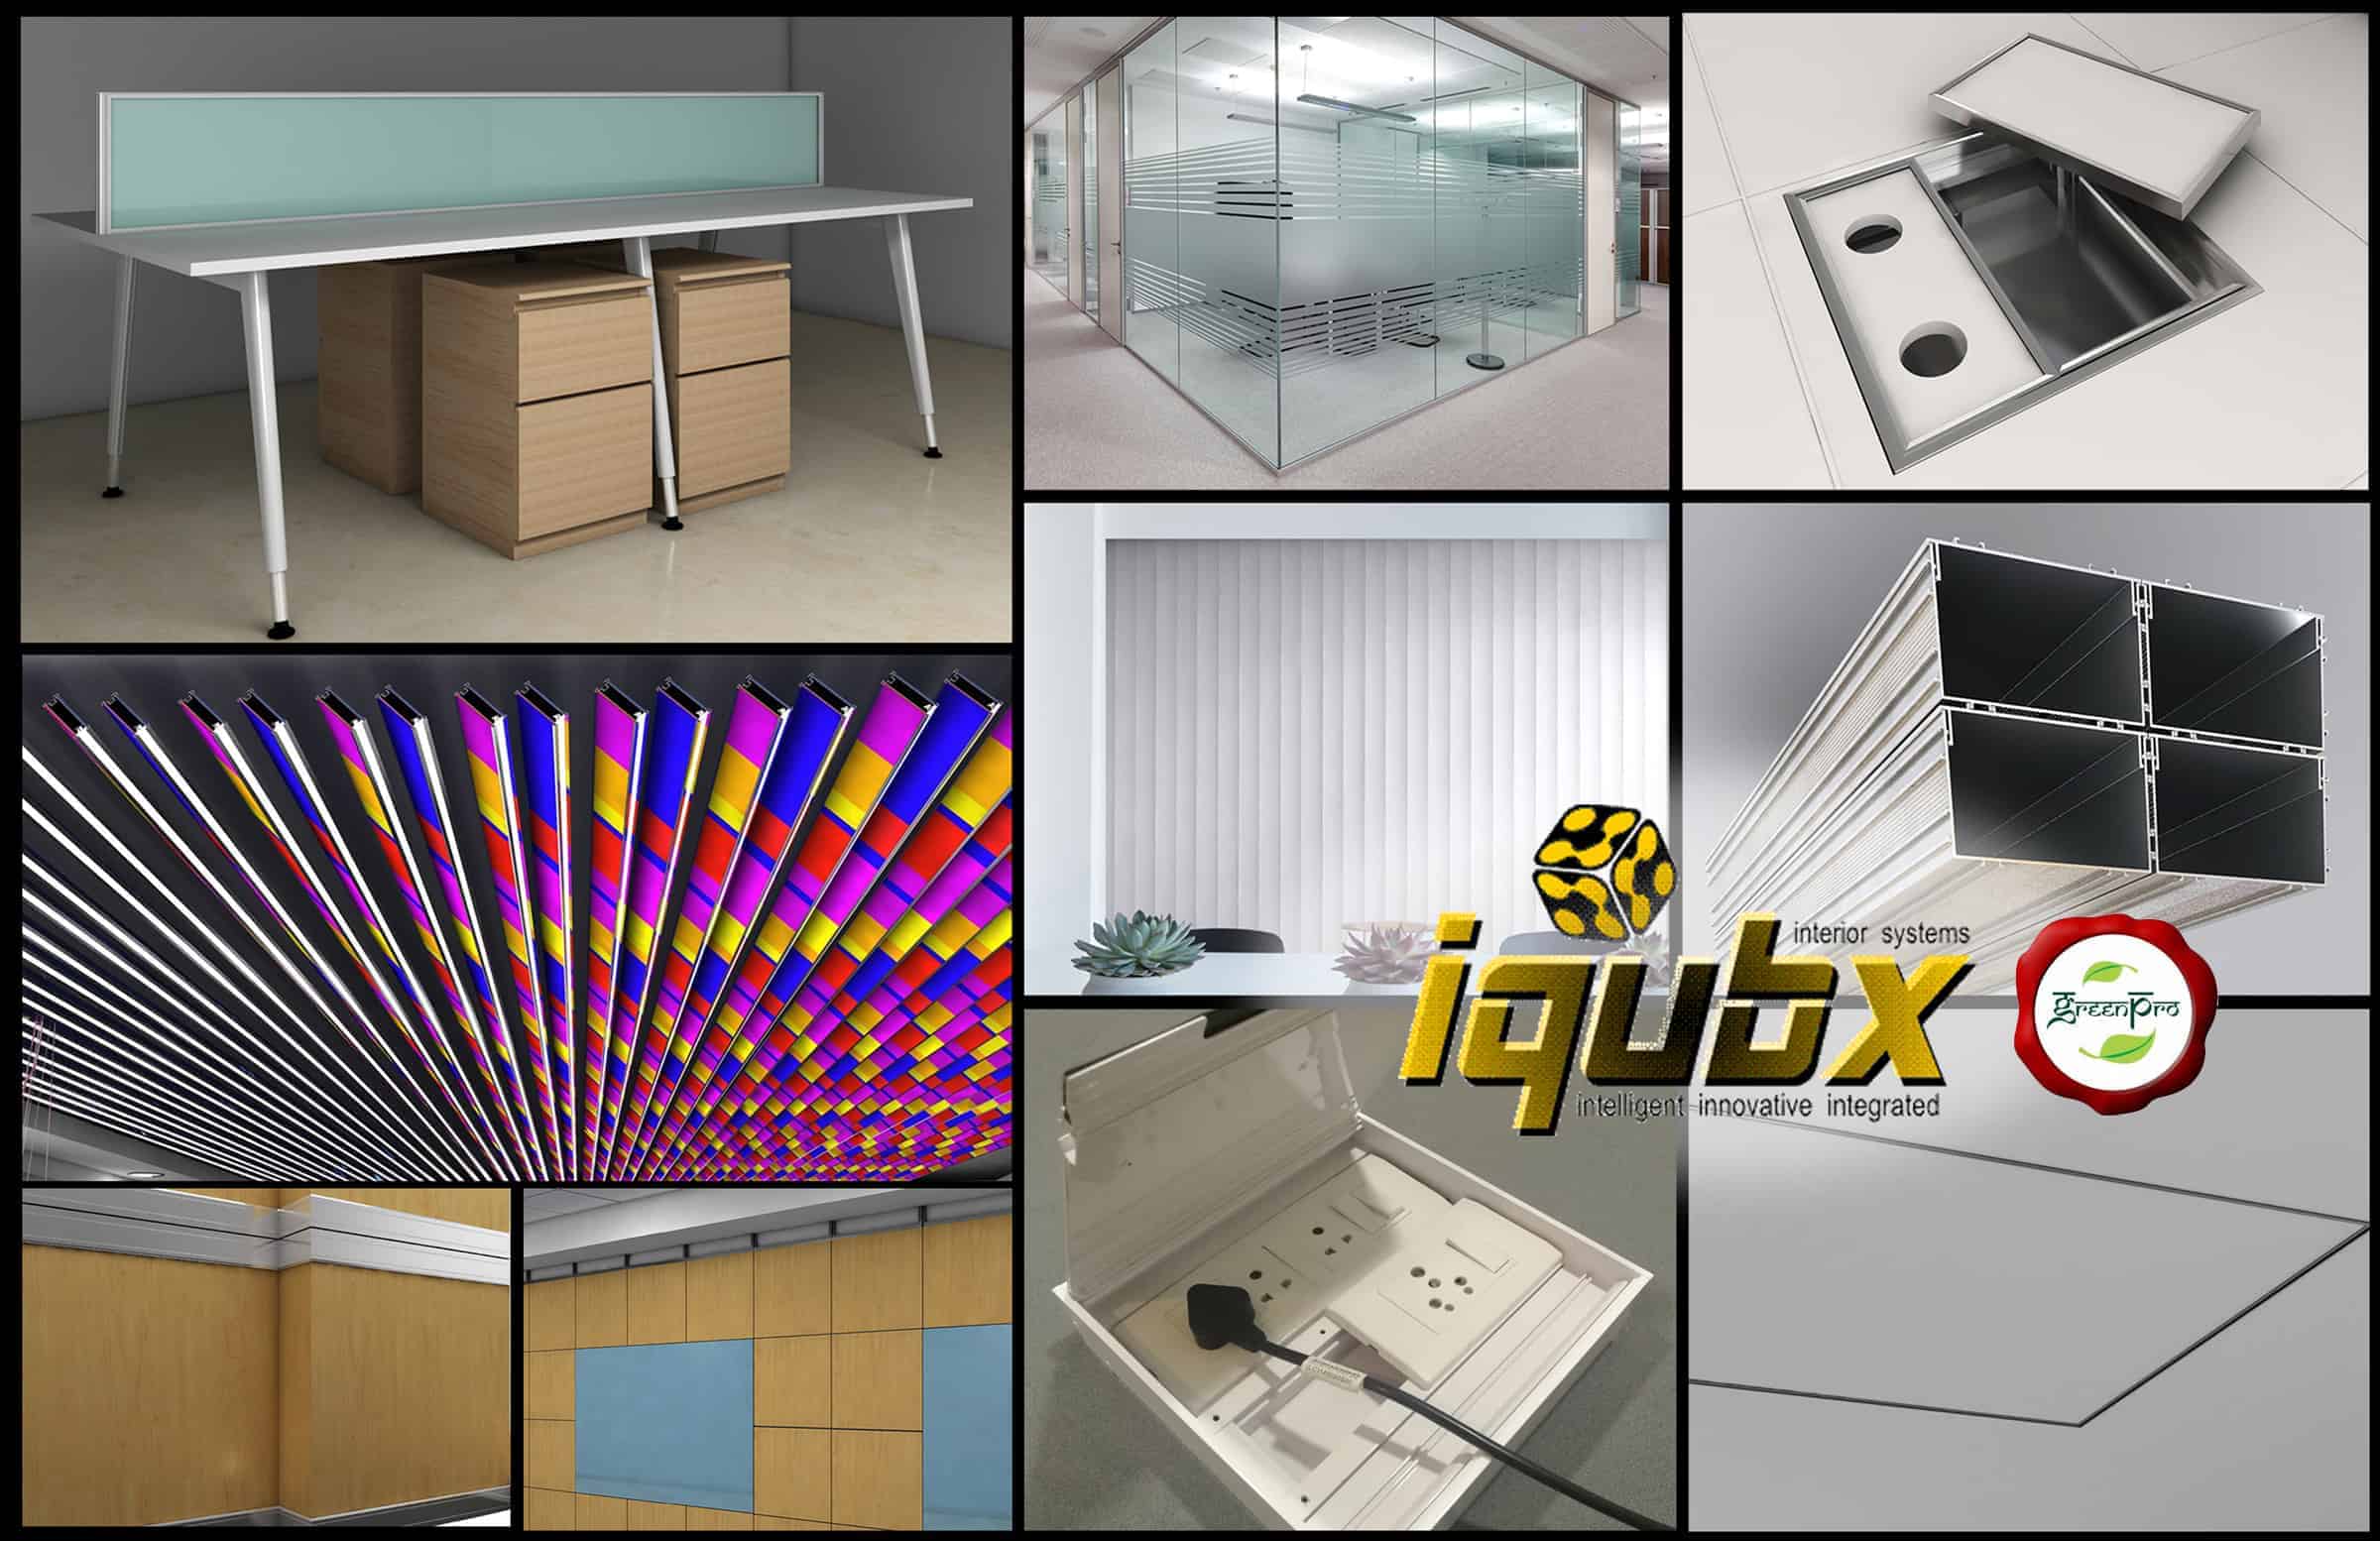 IQUBX interview in magazine Buildotech, oct-dec 2018 issue
-
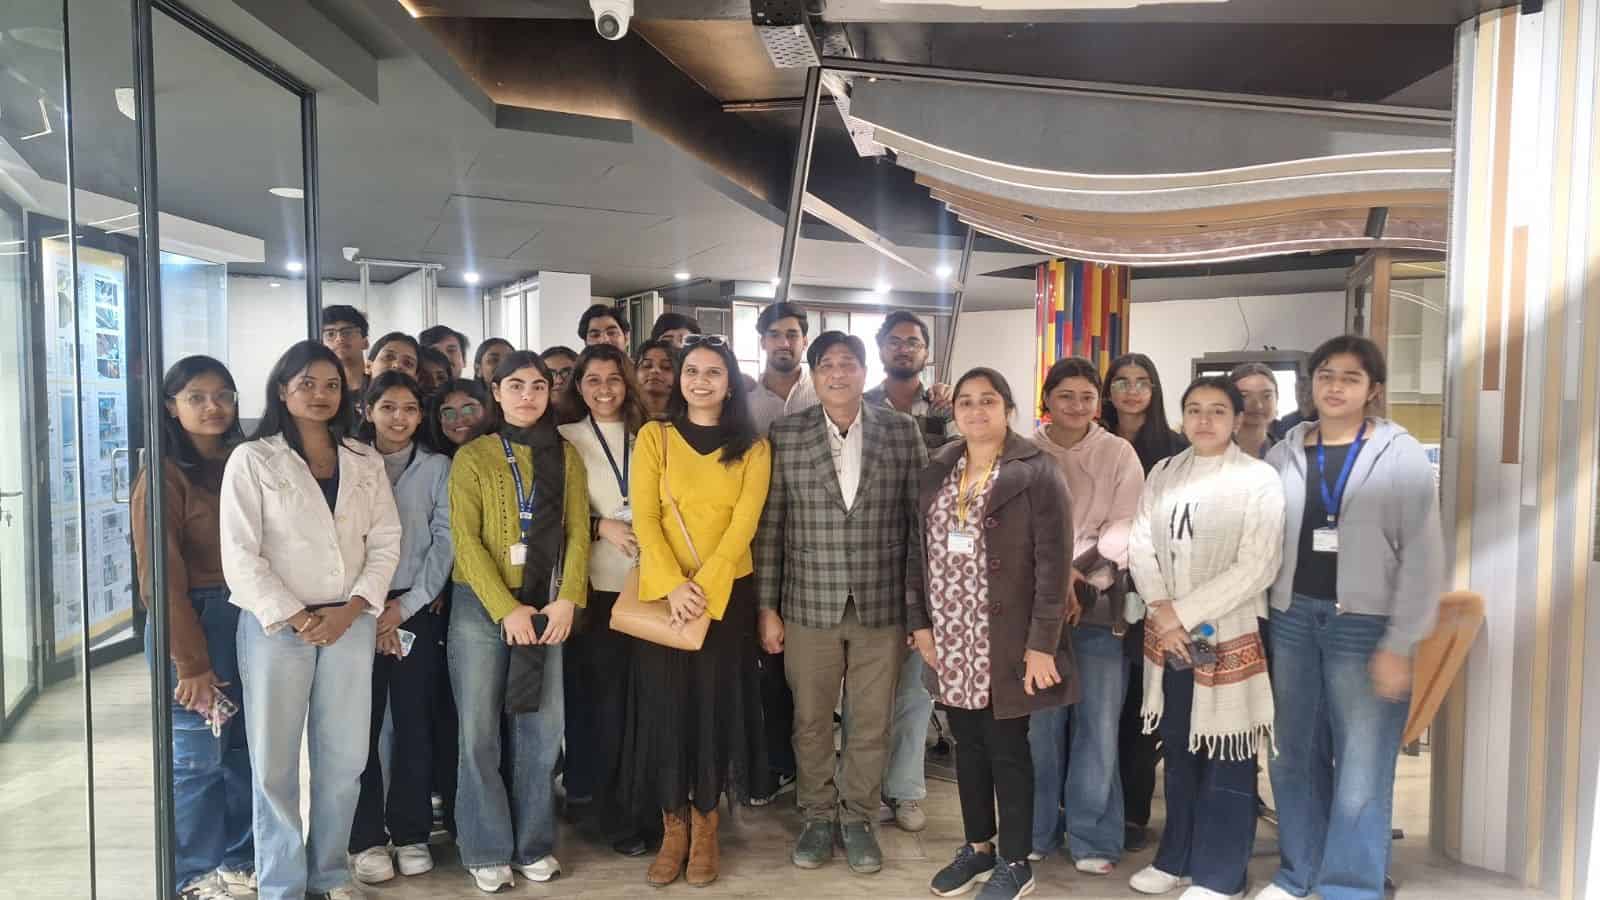 Industry–Academic Engagement at the IQUBX Innovation Experience Centre: Advancing System-Driven Design Thinking
-
 Relevance of shared cultural traits in contemporary built environment
About The Author

Amit Garg
CEO, IQUBX - Amit is an architect, Product Designer, Entrepreneur, ino-ventor, based in New Delhi, capital of India. Having an experience of more than 20 years in field of architecture. Subscribe to regular updates by IQUBX